How are People Doing Emotionally & Financially?

How are others doing emotionally and financially? We often compare ourselves to others without a clear picture backing those comparisons.
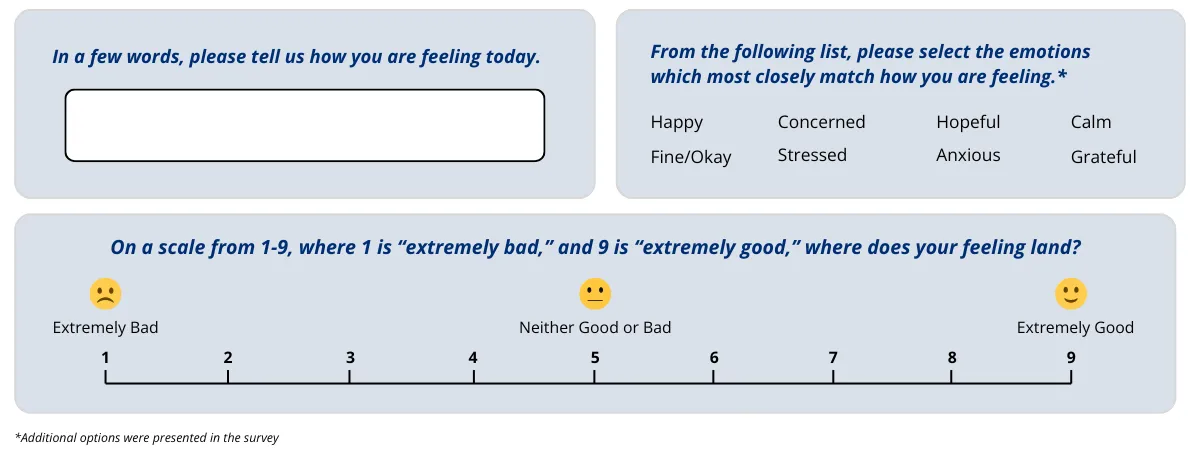
A recent study conducted by IntelliSurvey examined how adults in the U.S. and the U.K. report feeling, both in general and about their financial situation. To gain a comprehensive overview, participants were asked to describe their feelings through open-ended written responses, rate them on a nine-point scale, and identify specific emotions from a provided list.
TL;DR: Not Bad, But Not Great
- Generally speaking, people report that they are not doing badly, but they are not doing great either. Respondents’ feelings about their financial situation were less optimistic.
- In general and financially, women were more likely to select negative and neutral scores than men.
- In general and financially, UK respondents were more likely to select neutral scores than US respondents.
- For General Feeling emotions, women were more likely to select emotions like “Afraid,” “Stressed,” and “Fine/Okay” compared to men, who were more likely to select emotions like “Calm,” “Excited,” “Confident,” and “Happy.”
- For Financial Feeling emotions, women were more likely to select any negative emotion compared to men, who were more likely to select emotions like “Calm,” “Curious,” “Excited,” “Confident,” and “Happy.”
Want to know how this study was conducted? Scroll to the Methodology section below.
General Feelings Lean Positive, But Only Slightly
For the General Feeling section, we wanted to understand how people felt on the day they answered the survey.
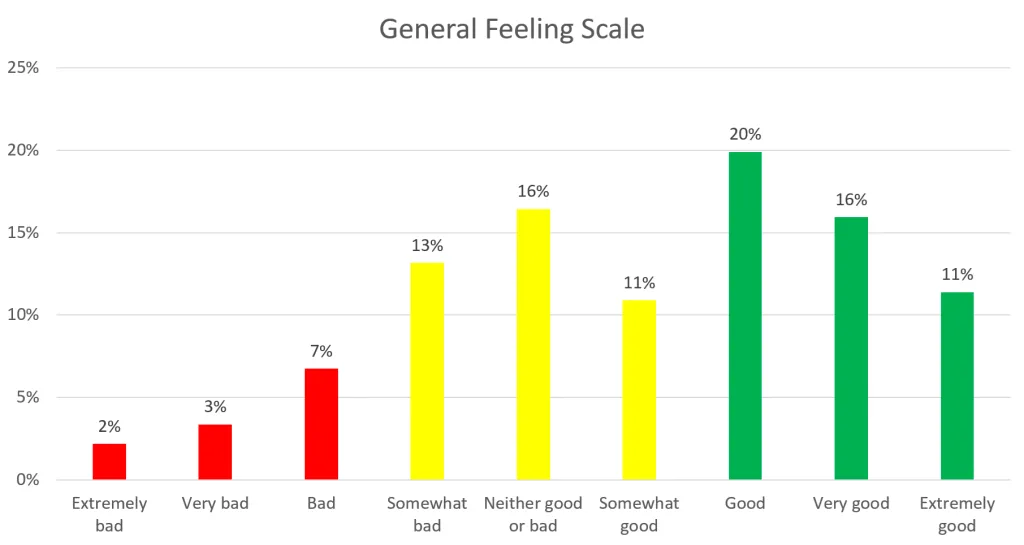
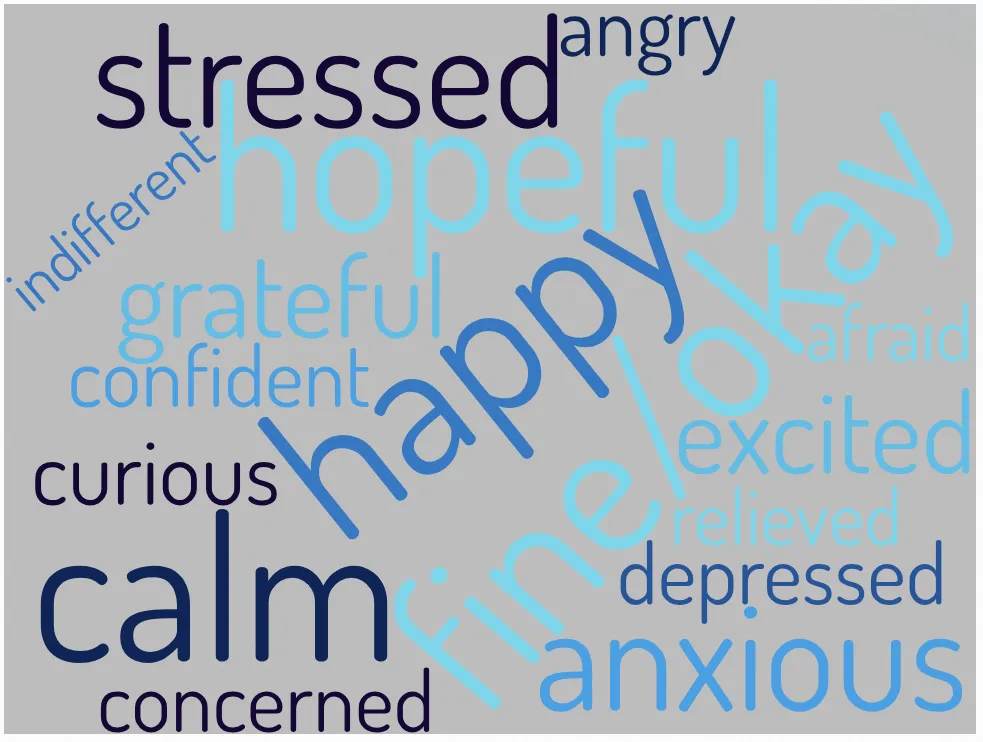
On the General Feeling scale, respondents averaged 5.99, indicating neutral feelings (4-6). When asked to choose emotions that aligned with their feelings, the five most common emotions were “Happy” (31%), “Fine/Okay” (29%), “Calm” (24%), “Hopeful” (20%), and “Stressed” (19%). Overall, half of the respondents selected positive (53%) and/or neutral emotions (51%), with one in three selecting a negative emotion (35%).
General Feeling by Countries & Gender
Respondents in the U.S. and U.K. reported nearly identical feelings, with the U.S. respondents reporting a slightly higher average than the U.K. respondents (6.01 vs 5.96, respectively). The main difference between the two appeared at the intersection of nationality and gender. Cross-tab analysis shows that U.S. women were much more likely to select positive answers (7-9) on the scale, while U.K. women were much more likely to select neutral answers (4-6). U.S. men and U.K. men did not differ statistically in their responses to the General Feeling scale. From the emotion list, the U.S. and U.K. respondents’ five most common emotions overlapped four times: “Happy,” “Fine/Okay,” “Calm,” and “Grateful,” with the only difference being “Hopeful” for the U.S. and “Stressed” for the U.K.
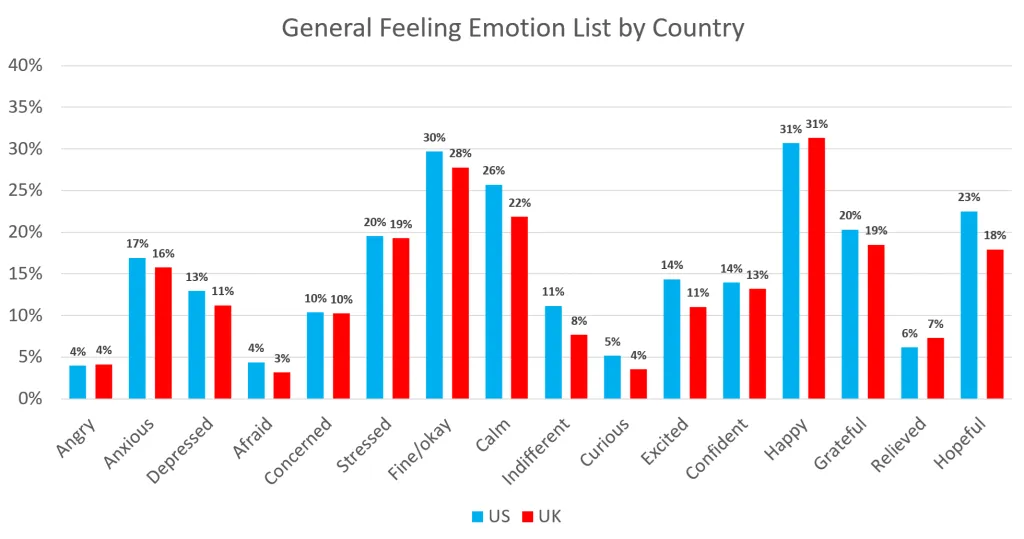
Note: Emotions shown in the above are grouped by sentiment, where negative emotions are on the left, neutral in the center, and positive emotions are on the right. Because respondents could select multiple emotions, the percentages (%) exceed 100%.
Men and women in our sample differed in how they reported feeling on the Likert scale (6.22 vs. 5.75, respectively). Women were much more likely than men to select a neutral or negative score and say they were feeling “Somewhat Bad,” while men were much more likely to say they were feeling “Very Good” and to select a positive score. When choosing emotions, women’s five most common emotions were “Fine/Okay,” “Happy,” “Stressed,” “Calm,” and “Anxious,” comprising one neutral, one positive, and three negative emotions. Men’s five most common emotions were “Happy,” “Calm,” “Fine/Okay,” “Hopeful,” and “Grateful,” which consist of three positive and two neutral emotions. This comparison highlights a clear gendered gap in general feelings, as women were more likely to select fewer positive, and more neutral and negative, emotions than men.
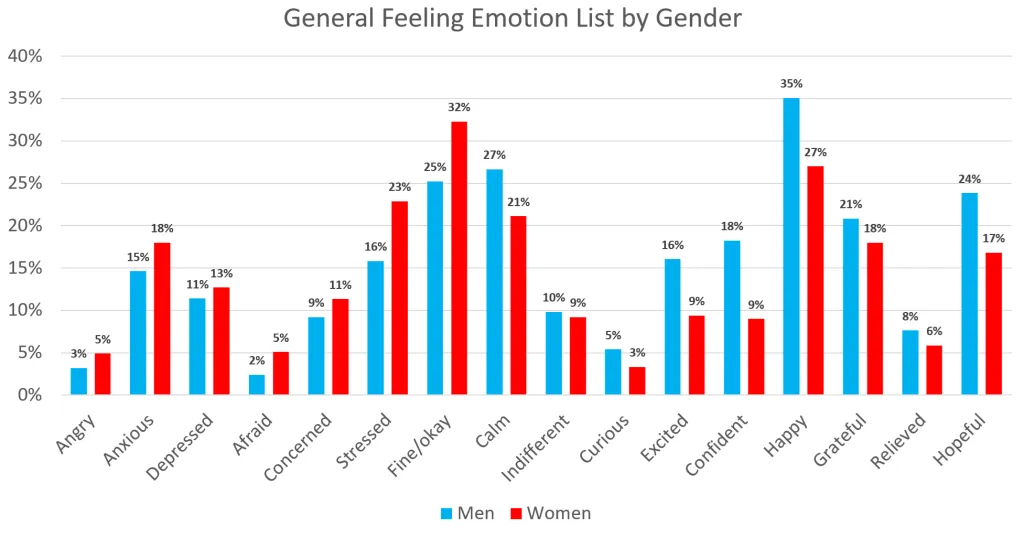
Note: Emotions shown in the above are grouped by sentiment, where negative emotions are on the left, neutral in the center, and positive emotions are on the right. Because respondents could select multiple emotions, the percentages (%) exceed 100%.
Financial Feelings Are Less Positive
For the Financial Feeling section, we wanted to understand how people felt about their financial situation.
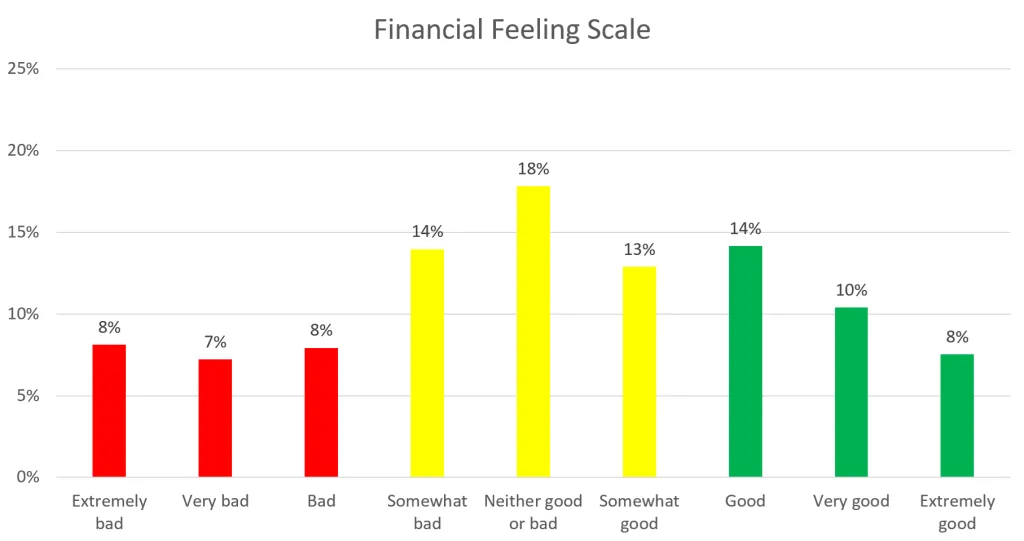
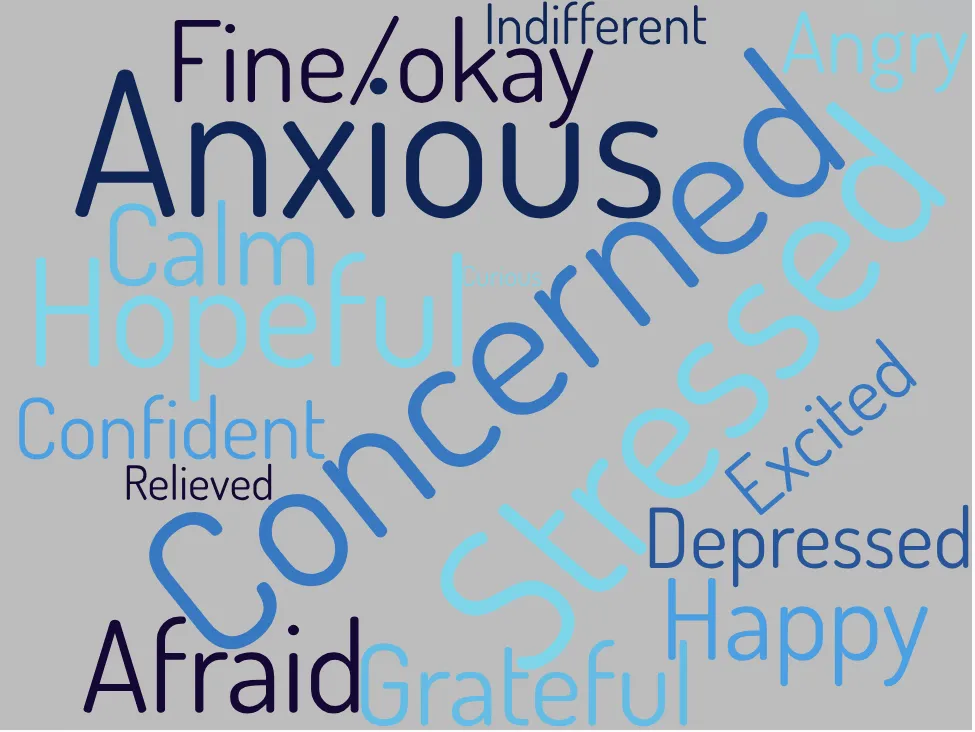
While respondents reported feeling neutral on the General Feeling scale, they showed more negative scores regarding their financial situation. The average score on the Financial Feeling scale was 5.19, which sits in the center of the neutral zone. The emotion list revealed that Financial Feelings skew towards the negative. Across the sample, the five most common emotions were “Concerned” (27%), “Stressed” (26%), “Anxious” (25%), “Hopeful” (22%), and “Grateful” (19%). Overall, half of the respondents selected negative (50%) and/or positive (48%) emotions, with one-in-three also selecting a neutral emotion (35%).
Financial Feeling by Countries & Gender
U.S. and U.K. respondents reported nearly identical Financial Feelings scores, with U.S. respondents averaging 5.20 and U.K. 5.17. Again, the differences between the national groups come down to differences in women’s responses. A cross-tab analysis showed that U.S. women were much more likely to select positive scores, such as “Extremely Good,” while U.K. women were more likely to select neutral scores, such as “Somewhat Good.” From the emotion list, the U.S. and U.K. respondents top-five selected emotions overlapped four times: “Stressed,” “Concerned,” “Anxious,” and “Hopeful,” with the only difference between “Confident” for the U.S. and “Fine/Okay” for the U.K. Respondents from the U.S. and U.K. both report more negative emotions and lower scores than in the General Feeling section.
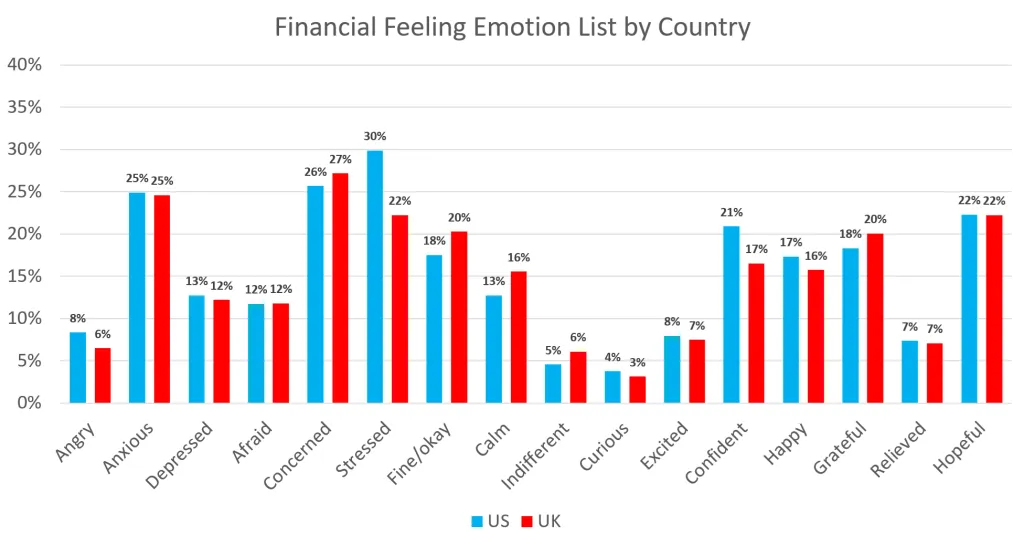
Note: Emotions shown in the above are grouped by sentiment, where negative emotions are on the left, neutral in the center, and positive emotions are on the right. Because respondents could select multiple emotions, the percentages (%) exceed 100%.
The gendered difference identified in the General Feeling section persists and deepens when examining financial feelings. When asked to rate their feelings, women reported lower average scores than men (4.94 vs. 5.44, respectively). A cross-tab analysis showed that women were much more likely to select negative scores, such as “Extremely Bad” or “Very Bad,” while men were much more likely to select positive scores, such as “Good” and “Very Good.” This stark difference persisted into the emotional selection question, where only one of the top five emotions for women was positive. In contrast, four of the top-five emotions for men were positive. When choosing emotions, the five most common emotions selected by men were: “Hopeful,” “Concerned,” “Confident,” “Happy” and “Grateful.” The five most common emotions selected for women were: “Stressed,” “Anxious,” “Concerned,” “Fine/Okay,” and “Hopeful.” These results highlight that while neither men nor women feel great about their financial situation, women report more negative financial feelings.
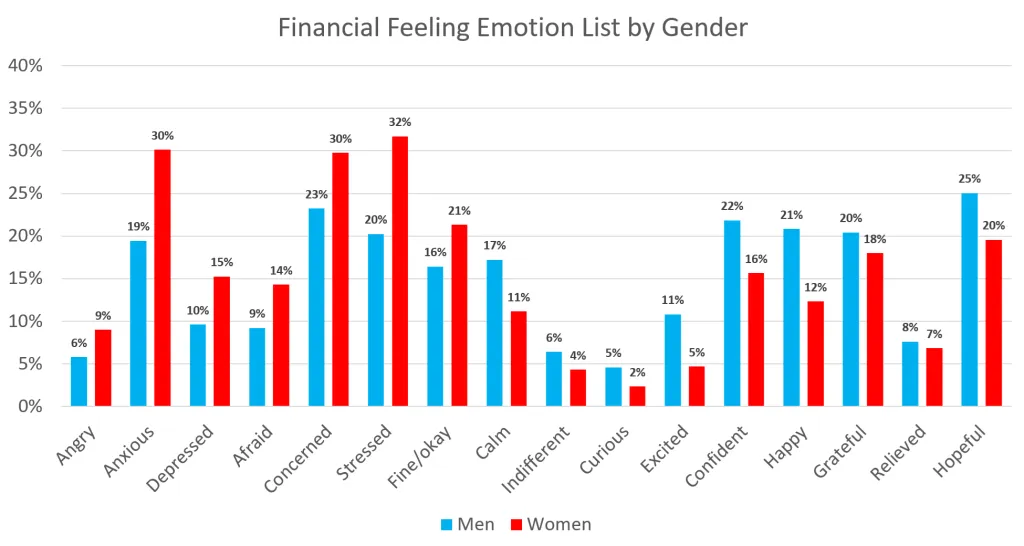
Note: Emotions shown in the above are grouped by sentiment, where negative emotions are on the left, neutral in the center, and positive emotions are on the right. Because respondents could select multiple emotions, the percentages (%) exceed 100%.
Conclusion: 2026 Is a Tough Year Emotionally & Financially
Our sample reported feeling neutral, with the General Feeling being slightly more positive than the Financial Feeling (5.99 vs. 5.19). The neutral distribution results from a sizable portion of the population reporting negative feelings about their general well-being and a majority reporting negative feelings about their finances. In 2026, it is fair to say that people are not feeling great, especially financially.
Our data also clearly show a gendered difference in how respondents felt. Even though the sample overall is feeling neutral, the data shows that women report feeling worse than men, both in general and in their financial situation. Women were much more likely to select emotions tagged as negative and to select scores in the neutral or negative range. In contrast, men were much more likely to select positively tagged emotions and select positive scores. This gendered difference is likely the result of patriarchal structures across both the U.S. and the U.K., which depresses women, both emotionally and financially.
Methods and Data
Capturing Feelings: Financial and Emotional
IntelliSurvey surveyed 1010 respondents from the U.S. (N=502) and the U.K. (N=508) to answer the following questions about how they were feeling in general and financially.
Short Answers
- General Feeling: “In a few words, please tell us how are you feeling today?”
- Financial Feeling: “In a few words, please tell us how you feel about your current economic status?”
Follow-up Questions
Likert scale: “On a scale from 1-9, where 1 is ‘Extremely Bad,’ and 9 is ‘Extremely Good,’ where does your feeling land?”
- All nine points on the scale are labeled (1 = Extremely Bad, 2 = Very Bad, 3 = Bad, 4 = Somewhat Bad, 5 = Neither Good or Bad, and so on, up to 9 = Extremely Good).
Emotion list: “From the following list, please select the emotions which most closely match how you are feeling.”
- The emotion list was a pre-defined list of emotions that could be clearly identified as negative, neutral, or positive.
Analytic Strategy
The General Feeling and Financial Feeling sections were analyzed independently and compared with each other. Within each section, averages and demographic-based cross-tabulation tables were used to analyze the data from the nine-point Likert scales. The nine points were also classified as negative (1-3), neutral (4-6), or positive (7-9) to enable sentiment-based analysis. For the emotion list question, all available emotions were predefined before the study. Because of this, we were able to select emotions that cleanly fit into negative, neutral, or positive categories, allowing for sentiment-based analysis.
Data Tables
Average Scores at a Glance
| Scales | Whole Sample | U.S. | U.K. | Men | Women |
|---|---|---|---|---|---|
| General Feeling Section | 5.99 | 6.01 | 5.96 | 6.22 | 5.75 |
| Financial Feeling Section | 5.19 | 5.20 | 5.17 | 5.44 | 4.94 |
Note: We used a nine-point scale where 1 = Extremely Bad, 5 = Neither Good or Bad, and 9 = Extremely Good. Scores above 5 can be understood to lean positive, while scores under 5 lean negative.
Top Five Emotions at a Glance
| Emotion Lists | Whole Sample | U.S. | U.K. | Men | Women |
|---|---|---|---|---|---|
| General Feeling Section | Happy | ||||
| Fine/Okay | |||||
| Calm | |||||
| Hopeful | |||||
| Stressed | Happy | ||||
| Fine/Okay | |||||
| Calm | |||||
| Hopeful | |||||
| Grateful | Happy | ||||
| Fine/Okay | |||||
| Calm | |||||
| Stressed | |||||
| Grateful | Happy | ||||
| Calm | |||||
| Fine/Okay | |||||
| Hopeful | |||||
| Grateful | Fine/Okay | ||||
| Happy | |||||
| Stressed | |||||
| Calm | |||||
| Anxious | |||||
| Financial Feeling Section | Concerned | ||||
| Stressed | |||||
| Anxious | |||||
| Hopeful | |||||
| Grateful | Stressed | ||||
| Concerned | |||||
| Anxious | |||||
| Hopeful | |||||
| Confident | Concerned | ||||
| Anxious | |||||
| Stressed | |||||
| Hopeful | |||||
| Fine/Okay | Hopeful | ||||
| Concerned | |||||
| Confident | |||||
| Happy | |||||
| Grateful | Stressed | ||||
| Anxious | |||||
| Concerned | |||||
| Fine/Okay | |||||
| Hopeful |
Note: The above data represents only the top five most common emotions selected from a predefined list. The emotions are shown in descending order by % selection.