
If you wrote out your current emotional state, do you think ChatGPT, Claude, Gemini, or another generic Large Language Model (LLM) would be able to identify the emotion you were feeling? Then, if you were to rate that emotion on a scale, do you believe a standard LLM would select the identical score as you, based solely on your written response?
IntelliSurvey asked over 1,000 adults how they were feeling to elicit written emotional statements to test a generic AI’s ability to perform basic sentiment analysis. In this article, we will look at the data and present how to best use a generic LLM to analyze respondents’ emotions and answer questions.
The Bottom Line
After running our analysis, we know AI can’t tell exactly how a respondent feels or match their exact scores on Likert scales. However, the AI closely mirrored the group in terms of group averages and data distribution. It was also good at simple sentiment analysis, meaning it could accurately identify if an individual’s sentiment, how they felt, was good (positive), bad (negative), or just okay (neutral).
Throughout our study, we identified four practices that help AI close the gap and better understand respondent sentiment.
- LLMs perform better when you design the survey with LLM analysis in mind from the start. It is a best practice to consider AI’s place in the study as early as possible in the survey design process, because failing to do so could lead to unintended outputs from the AI.
- LLMs are better at broad sentiment, like positive, negative, or neutral, but struggle with pinpoint accuracy. From our testing, we found that it was a best practice to analyze AI data at the aggregate level instead of the individual level.
- LLMs perform better when the task is more forgiving and the number of answer categories is lower. We found that it is a best practice to only give AI the tasks that are simple, straightforward, and have little wiggle room to hallucinate.
- LLMs will do better when given longer responses to analyze. It is a best practice to provide the LLM with ample context for it to do its work, such as requiring a minimum character count in open-end responses.
Method
IntelliSurvey surveyed 1,010 respondents from the US (N=502) and UK (N=508) to answer some benchmark questions:
- General feeling: “How are you feeling today?”
- Financial feeling: “How do you feel about your current financial situation?”
- Additional scale and list questions: Ordinal and Nominal data questions
Using respondent answers as a benchmark, we checked how well a common LLM could report matching those feelings on paper.
We used four analytic paths to see if an AI can tell how you are feeling.
- Respondents answered two 9-point Likert scales, and the AI tried to guess those answers.
- Likert scale #1 was simple and only labeled the ends (1 = Very Bad, 9 = Very Good).
- Likert scale #2 was context-rich and labeled all nine choices, from 1 = Very Bad to 9 = Very Good.
- Accuracy and data distribution were compared between AI’s responses to the simplified and context-rich scales.
- The LLM selected one or more emotions from a list of emotions to see where the AI’s picks overlapped with respondents’ emotions.
- We took the answers to the scale and emotion list and assessed the sentiment as positive, neutral, or negative. These sentiment categories let us check how well the AI’s responses matched up in a broader sense.
These four paths would provide us with measurable data to assess the accuracy of the generic LLM.
Likert Scale Comparison
We asked respondents two short open-end questions designed to elicit emotional statements. After answering the short response questions, respondents answered two 9-point scales (simple and context-rich), and the AI tried to guess their answers to those scales.
- Simple scale: endpoint answer options labeled with text
- Context-rich scale: all answers labeled with text
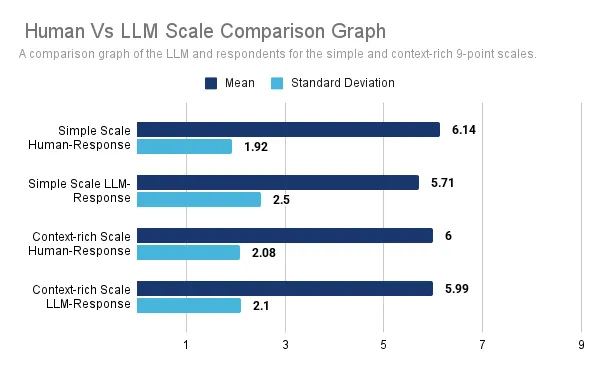
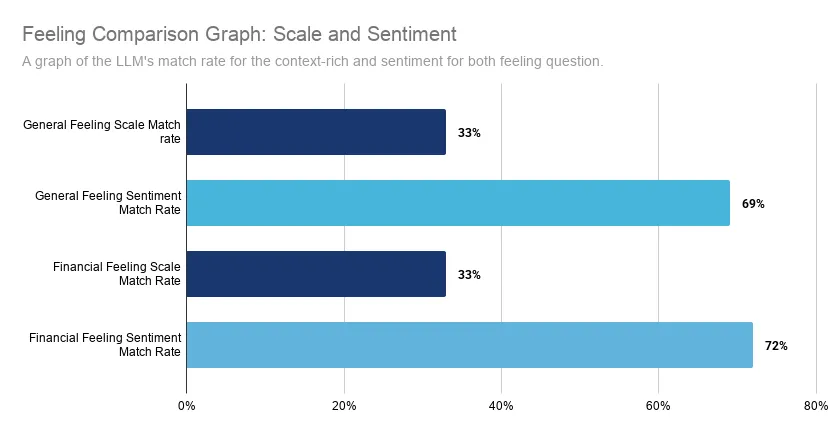
The context-rich scale consistently outperformed the simple scale, improving the match rates from 28% to 33%. Additionally, the AI’s average response for the context-rich scale was almost a perfect match to the respondent’s average, while the simpler scale showed a gap between the AI and respondent averages. The LLM’s standard deviation for the context-rich scale also more closely matched the respondent’s standard deviation.
These findings suggest that the context-rich scale is more suitable for a generic LLM, supporting the idea that the way you write your question is important to consider if you plan on using AI for sentiment analysis.
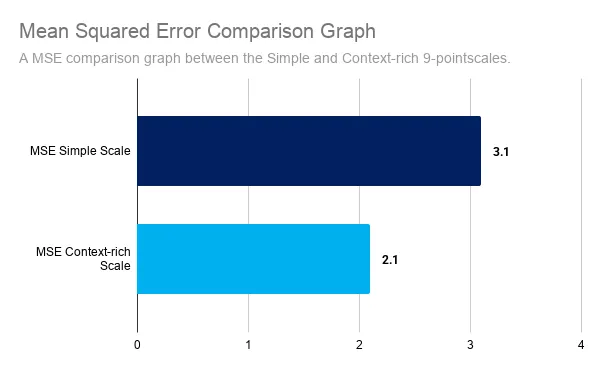
We ran a Mean Squared Error (MSE) to test the average difference between respondents’ and the LLM’s scores for the simple and context-rich scales. Lower scores mean a tighter spread of data and fewer errors.
The context-rich scale had an MSE of 2.1 points while the simple scale had a larger MSE of 3.1 points. This data reinforces that the context-rich scale works better for the AI model, solidifying that survey design is an important factor when using AI for sentiment analysis.
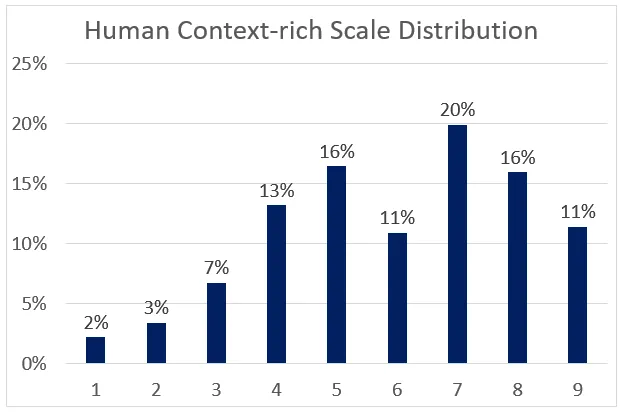
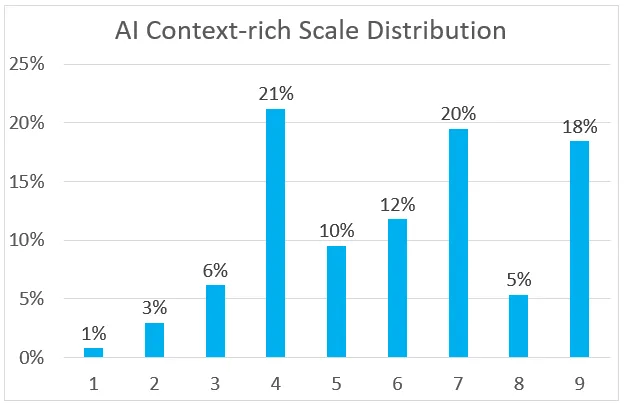
It’s important to mention that while the AI’s average matched the humans’ average on the context-rich scale, the exact match rate was only moderate (33%). The human distribution generally curved toward the positive end of the scale, while the AI’s distribution was more erratic, resembling tall mountains with deep valleys.
These distributions, the MSE analysis, and the accuracy comparisons show that pinpoint accuracy is not the AI’s strength, but that it can be used to broadly replicate groups statistically.
How close was the AI to being right?
While the AI was not always correct, we wanted to see how often its guesses were within one point of the respondent’s answer. The LLM’s exact match rate was 33% for the general feeling context-rich scale, with an additional 37% of AI responses within one point, resulting in a 70% close-match rate. When we ran the same test for the financial feeling question, the close-match rate was 73%, with 33% being an exact match and 40% within one point. These results show that while the LLM does not always get things exactly right, it is often quite close.
| Scales | % Match Rate | % Within 1 Point | Close-match Rate |
|---|---|---|---|
| Gen. Feel Context-rich Scale | 33% | 37% | 70% |
| Fin. Feel Context-rich Scale | 33% | 40% | 73% |
Sentiment Comparison
We wanted to know how well the AI performed when identifying broad sentiment. When we identified negative, neutral, and positive sentiments and compared their accuracies, we found that the LLM was better at identifying broad sentiment, improving its accuracy from 33% with the context-rich scale to 69% for sentiment scores. In the graphs below, you can see how the sentiment scores always achieved a higher accuracy than the scale-based questions.
Respondents’ Feelings of Matched Answers
With the human respondent acting as a benchmark for truth, we asked if the AI correctly guessed how they felt. We showed them the AI’s sentiment score (Negative, Neutral, Positive) for the general feeling question, then asked them to rate how correct the AI was, from “Very Incorrect” (1) to “Very Correct, Spot-on” (5).
Most respondents (76%) thought the AI was either Correct or Very Correct, while only 7% said the AI was Incorrect or Very Incorrect. This 76% agreement, along with the finding that the AI’s guess was close (within 1 point) 70% of the time, confirms that our analytic strategy is useful for understanding how well the AI is assessing sentiment.
Emotion List Overlap
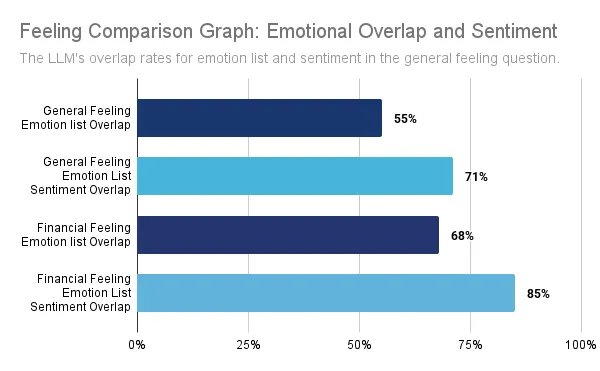
After respondents answered the short-answer questions, they were asked to select one or more emotions that most closely matched what they were feeling in their short-answer response. We wanted to know how well the AI could identify an emotion selected by the participant. We found that the LLM was able to identify at least one user-selected emotion 55% of the time, and when analyzed at the sentiment level, the accuracy improved to 71%.
This test shows that a generic LLM will perform better when presented with a more flexible task, as looking for any overlap in emotion selection is a much easier standard to achieve than an exact match on a scale.
Word Count Impact
We wanted to know if respondent answer length had an impact on the LLM’s performance, so we measured the AI’s accuracy rate across different lengths of user responses. We found that for the context-rich financial feeling scale, text length and accuracy increased together. The shortest category achieved a 33% match, and the longest increased to 38%. Sentiment categories showed a similar trend, increasing from 70% for the shortest responses to 77% for the longest responses.
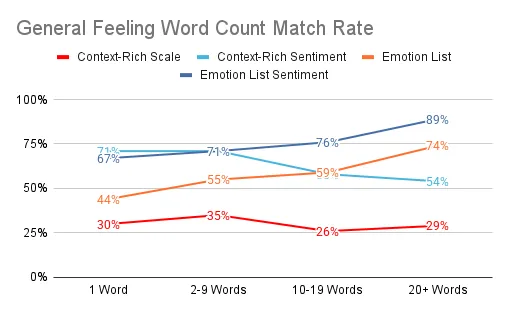
In contrast, for the general feeling question, the AI struggled with open-ended responses beyond 10 words, decreasing from a high of 35% to a low of 26% with longer responses. A similar pattern appeared within the sentiment category, dropping from 71% with the shortest responses to 54% for the longest responses. These differences are likely due to average response length. The financial feeling question elicited longer responses, averaging 9.7 words, compared to the shorter average responses to the general feeling question, 6.1 words.
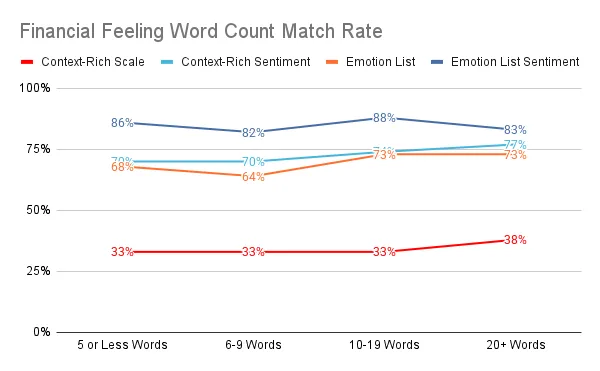
Emotion list questions showed consistent improvement with longer responses. For the general feeling question, the overlap increased from 44% to 74%, and the sentiment category overlap rate increased from 67% to 89%. For the financial feeling question, the overlap increased from 68% to 73%, but the sentiment category overlap rate decreased slightly, from 86% to 83%.
Taken together, this word count analysis helps us to learn two things.
- LLM performance tends to improve when provided with longer responses. The Financial feeling question elicited longer responses than the general feeling question (Avg. 9.7 words vs 6.1 words). So when we see that the AI does a better job with the financial feeling responses, we are probably seeing a difference in word count.
- LLM performance tends to improve when given more forgiving tasks, such as identifying emotion overlap or sentiment scores, rather than exact-match rates on a scale.
Accuracy by Country
In our survey of 1,010 people from the US (N=502) and the UK (N=508), we wanted to see if the AI was better at sentiment analysis for respondents from one country than the other. What we learned was that the AI had about the same accuracy across both countries, with a difference of less than 3% in most cases (6% being the largest).
| General Feel Questions | US % Accuracy | UK % Accuracy |
|---|---|---|
| Simple Scale | 28% | 29% |
| Simple Sentiment | 67% | 68% |
| Context-rich Scale | 35% | 32% |
| Context-rich Sentiment | 71% | 65% |
| Emotion List | 57% | 56% |
| Emotion List Sentiment | 73% | 73% |
| Financial Feel Question | US % Accuracy | UK % Accuracy |
|---|---|---|
| Simple Scale | 29% | 28% |
| Simple Sentiment | 68% | 70% |
| Context-rich Scale | 32% | 33% |
| Context-rich Sentiment | 70% | 70% |
| Emotion List | 70% | 67% |
| Emotion List Sentiment | 86% | 85% |
Key Learnings
Throughout our testing, we learned that:
- An LLM’s integration with a survey must be considered from the outset and cannot be added arbitrarily in the data analysis phase. The way a question’s answers are set up (e.g., context-rich vs. simple scales) and how the question is worded (General Feeling vs. Financial Feeling) impacts the LLM’s performance.
- LLMs do better with general sentiment rather than pinpoint accuracy. LLMs are not built to produce virtual twins, but can be used to broadly understand trends found in the data, as evidenced by our accuracy comparison tests.
- LLMs do better when their task is flexible, and their ability to get things wrong is reduced. The emotion list overlap test and the close-match rate test prove this.
- LLMs will do better when provided with longer responses to analyze. From the word count comparison tests, we saw evidence that the AI performed better as the word count increased.
To answer the question from the outset of this article, an AI LLM cannot actually identify the emotion you are feeling. However, the results of this study demonstrate that a generic LLM can still be a powerful tool to analyze the sentiment of written responses when circumstances align. Our key findings indicate that factors such as question type, response length, task, and survey design are critical for the optimal performance of a generic LLM.
While LLMs are not a replacement for human-driven sentiment analysis, their utility in broadly analyzing respondents’ emotions is significant.